> The analyst that exits 0.
Hand forge the brief — sizing, deep dive, IR digest, scenario — and get a sourced, auditable answer back in the shell. Bilingual. No dashboards.
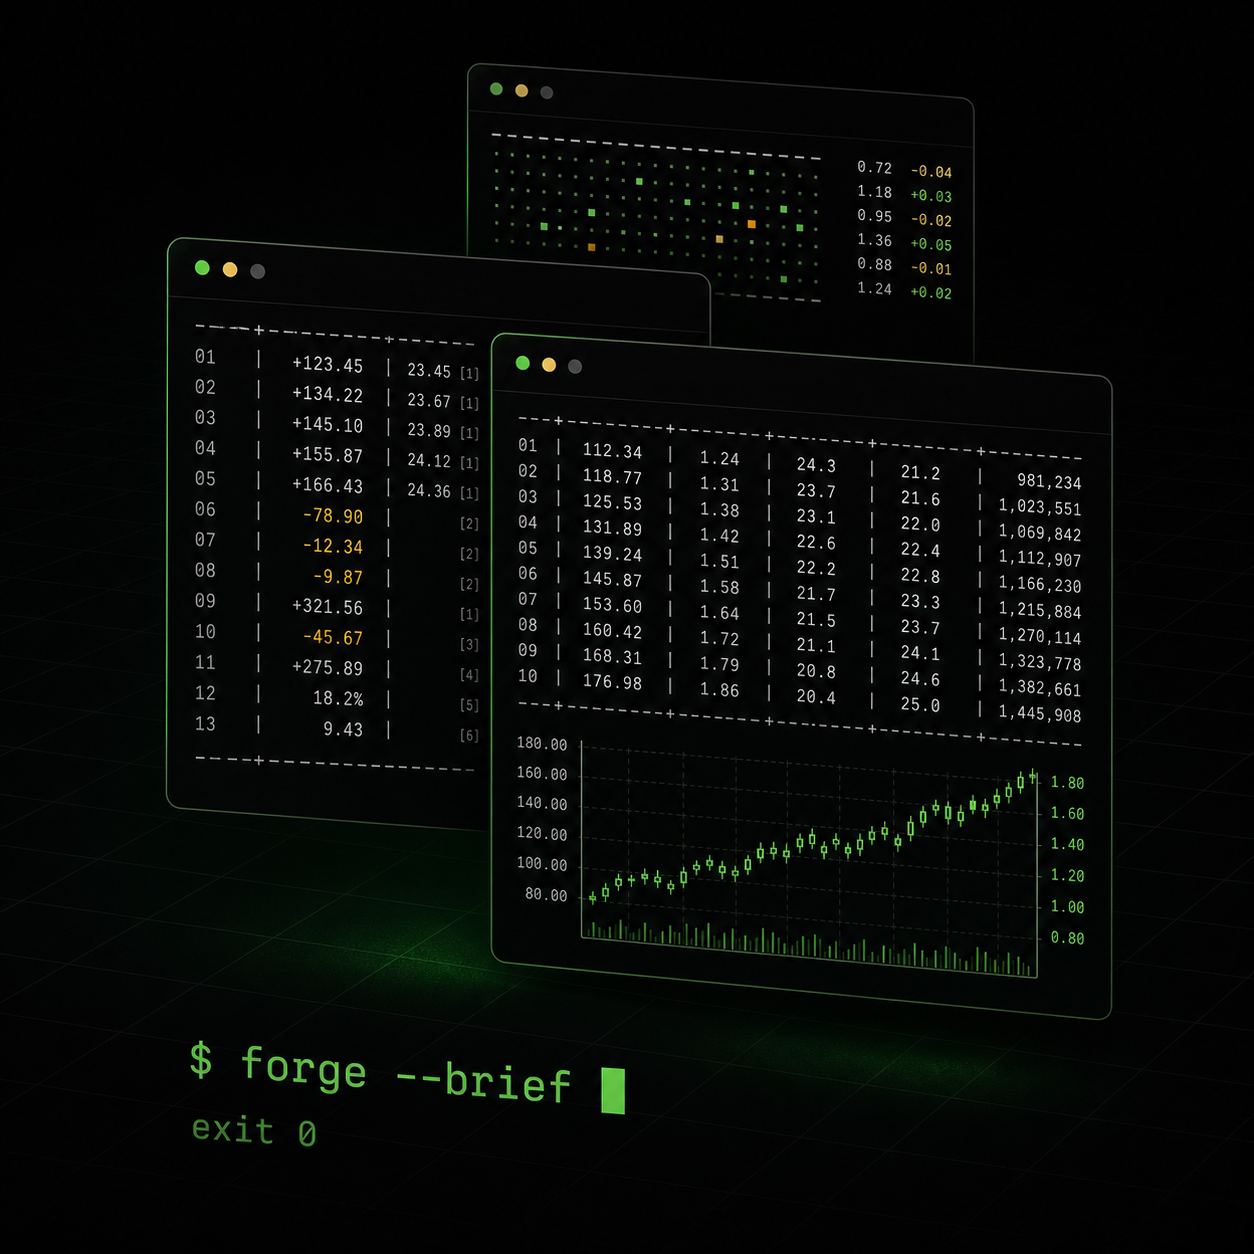
$ research --as-shell
Reads. Computes. Cites. Every figure traceable back to a primary source or it doesn't ship.
# Reads what you can't
Thousands of pages of filings, transcripts, repos, docs — extracted into the rows and columns you actually need.
# Bottom-up by default
TAM/SAM/SOM with assumptions you can pressure-test, not consensus numbers handed back uncritically.
# Models you can audit
DCF, segment walks, comparables — every input traceable to a citation. Output as CSV when you ask.
# Dev-tooling fluency
Speaks GitHub stars, npm downloads, Stack Overflow trends, K8s charts. Treats devtool research as a first-class verticals.
Market & Sector Sizing
TAM / SAM / SOM, segment trends, devtool category heat maps.
$ Estimate TAM/SAM/SOM for the AI code-review tooling market, bottom-up: global professional dev count, average review-tooling spend per dev, addressable share for AI-native vendors. State every assumption.
$ Size the observability category (Datadog, Grafana Labs, New Relic, Honeycomb, Splunk). Split spend by APM, logs, metrics, RUM, security. Use bottom-up by enterprise tier.
$ Map the CI/CD vendor landscape (GitHub Actions, GitLab CI, CircleCI, Buildkite, Harness) on a 2×2 of (workload locality) × (deployment model). Pricing economics per build-minute.
$ A 22% CAGR through 2029 is forecast for "vector databases". Pressure-test with 3 supply-side and 3 demand-side inputs. What would have to be true for that to hold?
$ Within edge / serverless platforms (Cloudflare Workers, Vercel, Fastly, Deno Deploy), rank sub-segments by 24-month enterprise revenue momentum and net retention proxy.
$ I am sizing the open-source AI inference market. Rank the 5 most credible primary sources, what each is good for, and where they materially disagree.
Company Deep Dive
Financial modeling, business-model decomposition, KPI walks — devtools and beyond.
$ Draft a conservative 5-year DCF for Datadog at current consensus. State WACC, terminal growth, and the 2 sensitivities that matter most. Flag any input treated as assumption vs. cited.
$ Sony's operating margin expanded ~300 bps over the last 3 fiscal years. Decompose the walk by segment, price/mix, and one-time items. Cite the MD&A paragraph for each driver.
$ Build a "quality" screen for global large caps: ROE > 15%, FCF margin > 12%, Net debt / EBITDA < 1.5×, 5-yr revenue CAGR > 7%. Output SQL-style criteria and 3 names this captures.
$ Reconstruct SaaS unit economics from a public ARR + customer count + S&M spend: $200m ARR, 10,000 customers, $80m S&M. Compute CAC, payback period, LTV/CAC at 90% gross retention.
$ For an open-core devtool company (e.g., HashiCorp pre-IBM, GitLab, MongoDB), reverse-engineer the conversion funnel from OSS users → paying enterprise. What benchmark conversion rates look healthy?
$ Argue the strongest 3-point bear case for Shopify at current valuation. Use only points a skeptical long/short analyst would lead with — not generic macro takes.
Competitive Intel
Feature matrices, pricing teardowns, positioning maps, win/loss extraction.
$ Build a 14-row feature matrix comparing GitHub Copilot, Cursor, Cody, and Windsurf on completion latency, agentic edit, multi-file context, language coverage, enterprise SSO, on-prem. Flag where vendor docs disagree.
$ Take apart the pricing of 5 B2B observability vendors (Datadog, New Relic, Splunk, Grafana Cloud, Honeycomb). Compare list pricing, real enterprise deal economics, overage exposure at 2× growth.
$ Plot 8 generative-AI coding assistants on a 2×2 of (target buyer: indie ↔ enterprise) × (interface: chat ↔ agent). Briefly justify each placement with one named customer or pricing tier.
$ Vendor X just shipped an agentic refactor feature (3 news items attached). Reverse-engineer the strategic intent and outline 3 counter-moves for a competing PM with a 1-quarter timeline.
$ From 6 win/loss interview transcripts (attached), extract the top 3 reasons we win and top 3 we lose. Quote evidence verbatim. Tag each quote with role + segment.
$ We are repricing our enterprise tier of a CI/CD product. Map willingness-to-pay across 4 dimensions (seats, build-minutes, sensitive data, support SLA) using competitor benchmarks.
Capital Markets & Macro
Rates, FX, inflation, policy transmission, sector rotation.
$ Diff the latest FOMC statement against the prior one (word-level). Identify hawkish/dovish shifts and map each to a likely first-day reaction in rates, USD, and equity sectors.
$ Decompose the latest US CPI print into goods, services ex-shelter, shelter, and energy. What does each say about the Fed's reaction function over the next 2 meetings?
$ Build 3 BoJ policy paths over the next 12 months (status quo, gradual normalization, sudden hike). For each, project USD/JPY range and the 3 most exposed Japanese sectors with a 1-line thesis.
$ Explain the current shape of the US Treasury curve, what it implies for 12-month forward growth and inflation, and which historical analog it most resembles by shape and macro context.
$ Across the past 4 US recessions, which equity sectors led the recovery in the first 6 months after the trough? Show base rates and one structural reason per sector.
$ If US 10-year real rates fall 100 bps over 6 months, walk through the impact on long-duration tech, gold, EM equity, and JGBs. Quantify directional, not point estimates.
Filings & IR
Structured extraction from primary disclosure — 10-K, S-1, 有価証券報告書, transcripts.
$ From the attached 10-K, extract the risk-factors section and rank by materiality given the company's current business mix. Quote the sentence supporting each rank.
$ Summarize the MD&A of the attached 10-K in 200 words: revenue drivers, margin drivers, forward-looking guidance. Cite each claim by paragraph reference.
$ Identify any accounting-policy changes, restatements, or critical-estimate revisions in the attached annual report. Explain what each implies for earnings quality with one sentence.
$ From the financial-statement footnotes, surface 5 items most investors miss: contingent liabilities, off-balance-sheet exposures, related-party deals, segment reclassifications, and one of your choice.
$ From the attached S-1, extract growth metrics, cohort behavior, customer concentration, and any disclosure that quietly contradicts the headline narrative. Quote evidence.
$ From the attached earnings-call transcript, identify the 3 questions analysts pressed hardest. Summarize management's answers and rate answer quality 1–5 with one-line justifications.
$ how --it works
> You frame the brief
Market size, model, filing digest, scenario. Any analyst-shaped ask, one sentence in.
> It reads and computes
Pulls primary sources, parses disclosures, runs the spreadsheet logic. Streams while it works.
> You get sourced output
Tables, walks, citations. Auditable. Pipe to a deck, a model, or a Slack thread.
$ Hand the agent the brief.
Free to try. Bilingual. Runs in a shell, not a dashboard.
$ open a shell